Methods, Coordinates, Precision, and Margins of Error
Precise geodesy is a recent historical achievement. Geodesy as a science measuring the earth has attained the mathematical precision needed to assess if past civilizations measured the earth with precision. New technology makes the ability to determine the latitude and longitude of a monument, be that a petroglyph or a modern property marker, accessible with known accuracy to anyone with a hand held GPS device or even a smart phone. Personal computers with access to satellite imagery displayed by a geograhic information system (GIS) allow determinations of latitude and longitude of any visible feature on the earth. While vastly improved precision in recent decades capacitates this study, margins of error need to be understood in quantifiable terms and must be accounted for in determining confidence in interpretations of data and results.
Accurate determination of ancient monument coordinates can be problematic. Over recent decades it has become much easier with the capacity for precise GPS readings, the world geodetic system (WGS84), online availability of maps and shared photography, and, when precise data is not elsewhere found, GIS tools such as Google Earth (GE). Over time the precision of GE has improved as updates with higher resolution imagery and refined imagery placement increase the area useful for archaeological research.
To the extent possible I use GPS data for site coordinates and when recording my own data I annote the GPS margin of error. GPS data varies in accuracy and margin of error is not always noted. Comparison of my own GPS data of Eastern Woodlands and Southwest monuments with GE high resolution imagery positioning confims accuracy sufficient for many purposes of my studies. The GPS data also allowed observing improved accuracy over time with GE high resolution imagery updates. The GE historical imagery tool enables viewing older satellite images. I database the access date when recording GE-based coordinates to time reference the data capture. The Ministerio de Cultura's Machupicchu detailed site map with a UTM grid verified the accuracy of GPS-determined coordinates, revealed the GE image displacements, and improved the accuracy of some older GPS data and several GE determined coordinates.
What most impacts GE precision in relation to Machupicchu is the terrain, vertical mountains. Obliqueness of camera position is a significant accuracy issue with GIS tools employing satellite imagery. Almost all satellite imagery has an oblique camera angle, and with steeper terrain the margin of error is in all probability proportionally greater. This aspect of employing photography is correlated with departures from a flat landscape in the image capture area in combination with the degree of obliqueness. Needless to say, in and around Machupicchu the vertical landscape exacerbates this problem, necessitating quantification of the error variable. To get a good idea of how oblique camera angles impact point positions in the imagery, use the Historical Imagery tool in GE to compare the various captures of the pyramids at Giza. While the pyramid bases remain in almost exactly the same positions, the apparent area of the pyramid sides changes immensely and the apex coordinates shift considerably. With monuments of any prominence, I always use the monument base to determine centerpoints, rather than the apparent summit in a satellite photo.
Now consider the relative height difference between the Great Pyramid and the mountains around Machupicchu or even just the difference between the buildings at Machupicchu and the summits of Montaña Machupicchu and Waynapicchu and the problems presented by overlaying 2-D satellite images on 3-D terrain are ready discernible. The following image (Figure 3) illustrating the margin of error at Waynapicchu is included in the KML file along with individual placemarks for the tessellated red lines. You can interact with the Historical Imagery tool in GE and observe the placement of the mountain summit shift to the endpoints of the dated lines.
Geodesy, Waynapicchu, and Margins of Error
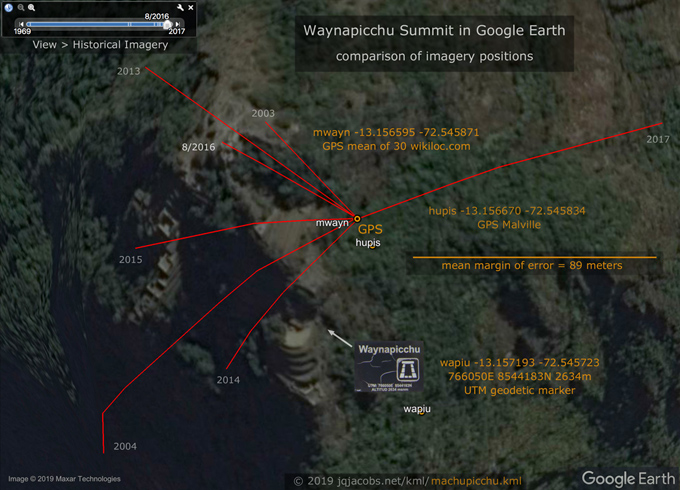
Figure 3. Placement of satellite imagery of vertical terrain.
This image and the placemarks illustrate the margin of error problem inherent in determining coordinates from satellite imagery of vertical terrain. The image was captured after tessellating the red line placemarks from the varying positions of the summit in GE historical imagery photos to my Waynapicchu summit placemark, mwayn. I downloaded wikiloc.com GPS hiking tracks and used thirty summit waypoints to determine a mean position, the mwayn datum. The GE measure tool scaled the distance from the mwayn datum to the varying summit image placements. Their 89 meters average is the scale in the graphic. The recent June 2020 imagery update with better image resolution places the summit about 70 meters from the placemark. To include the Historical Imagery slider the image was captured without centering on the summit in the 2016 imagery, hence the angles of the topography model distort the lines. Dr. Kim Malville sent me the displayed summit GPS datum hupis without a recorded margin of error and with two deep decimal digits transposed which I corrected. This hupis datum and the Intiwatana GPS datum (intiw) are older GPS readings and share a near equal displacement from recent determinations (mwayn and intih). |
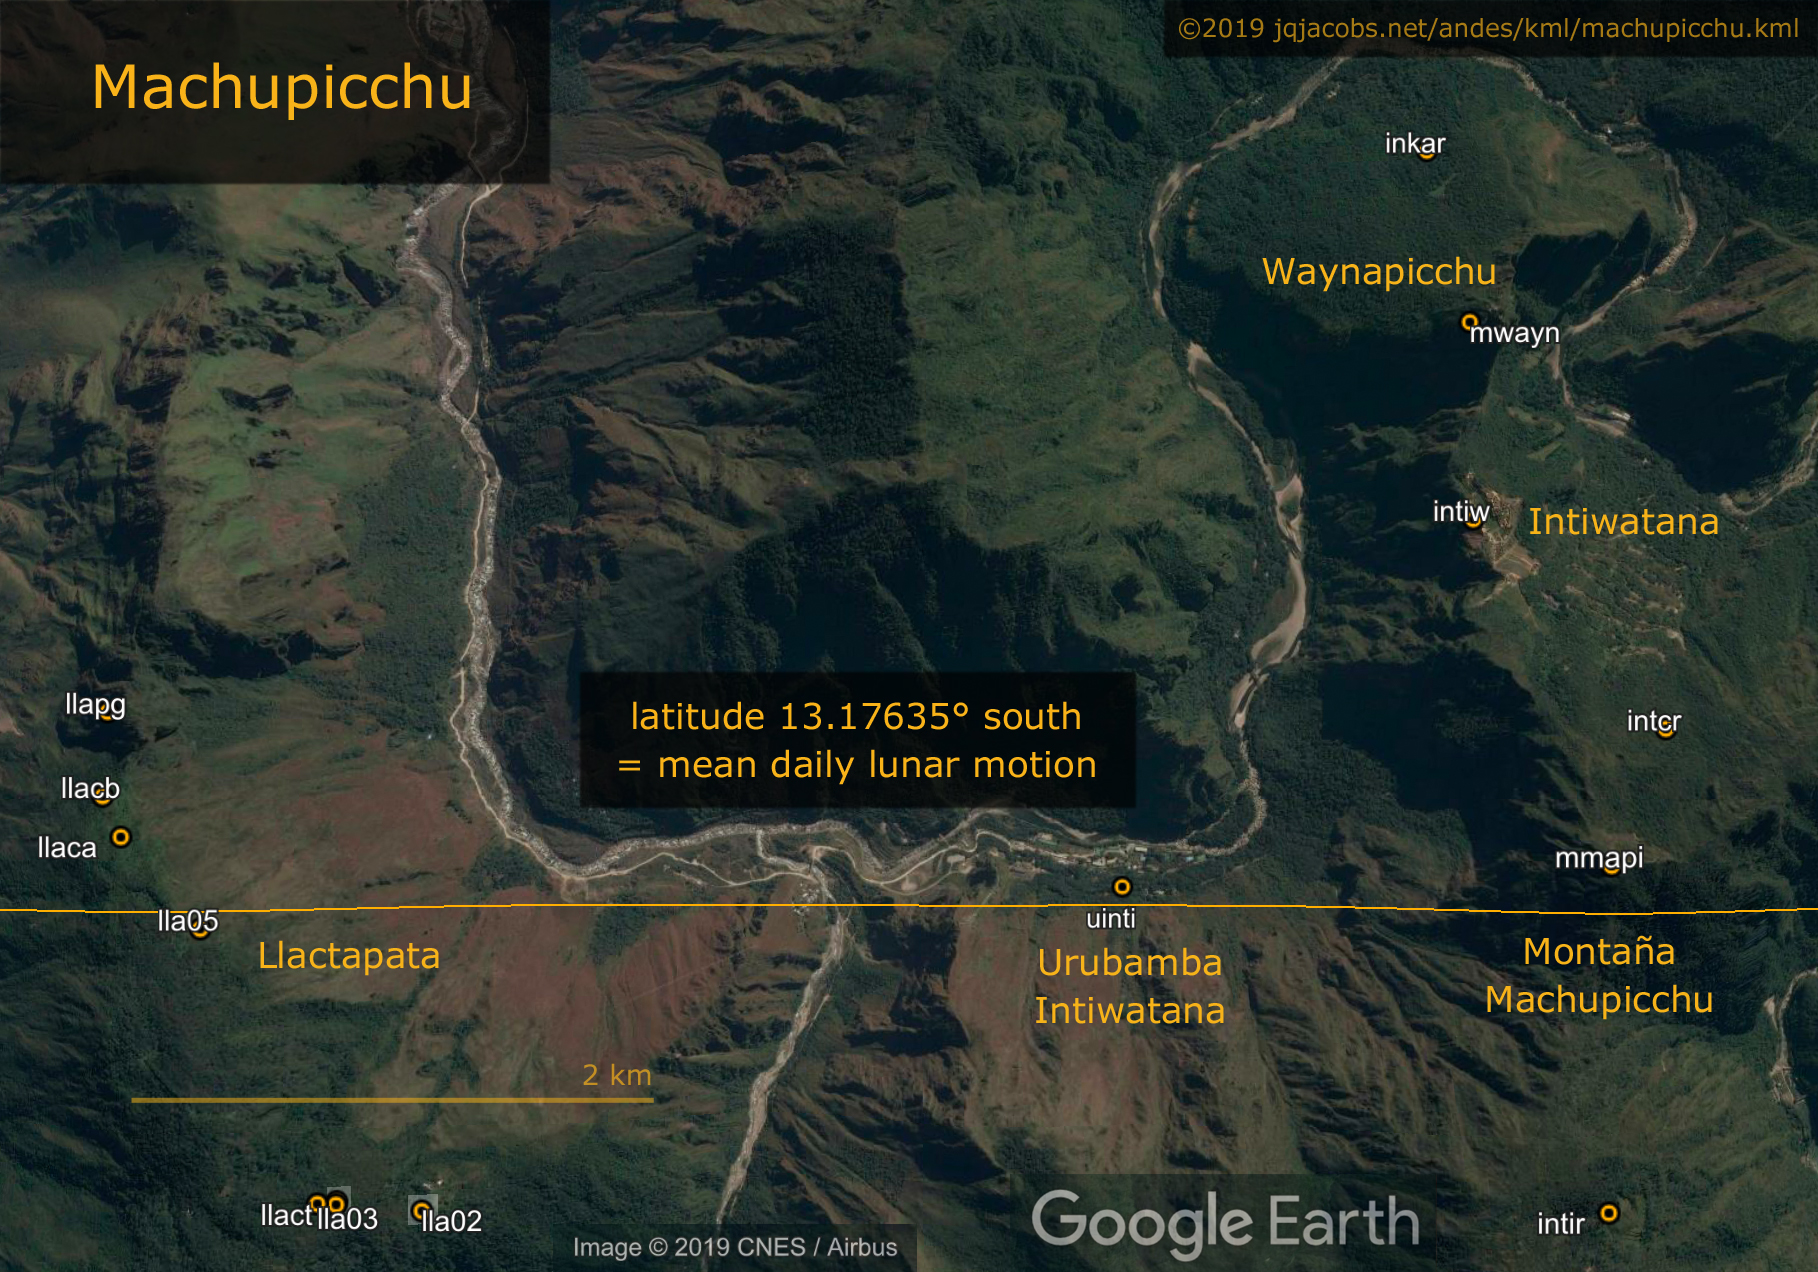
With steep terrain, GPS data for monuments and summits overcomes the significant problem of resolving accurate coordinates from satellite imagery. I continue to research and request GPS data and any contributions of data are appreciated. The number of useful online data resources has increased recently. GPS is becoming ubiquitous with cellular phone usage. Phone apps record user positions and hikers post track files and photography on websites dedicated to sharing data. For both Machupicchu and Waynapicchu peaks, I crowdsourced the currently available data on wikiloc.com to derive mean coordinate and thereby reduce margins of error in the coordinates. Steep terrain presents problems for GPS accuracy also by limiting the number of satellites having reception, but at least atop the peaks that problem is negated and hikers also tend to remain still there for an interval. Cellular phones are not the most precise GPS devices, so I determined mean coordinates from numerous waypoints and favored tracks produced by dedicated GPS devices. Tracks with higher margins of error are discernable and I avoided these.
The margin of error in imagery placement for the Machupicchu ruins is far less than for Waynapicchu summit, but nonetheless more than seen in flat terrain. Crowd sourcing the wikiloc.com GPS tracks was useful in determining which historical imagery placement of the architectural features and paths was most accurate in relation to the GPS data, thus providing more confidence in the accuracy of updated and added coordinates and improved quantification of margins of error. Visitors to the site are delimited to walking specific paths and this fact increased the utility of their GPS tracks. Detailed archaeology site maps, information in The Machu Picchu Guidebook, and the multitude of shared photographs online, all in combination, now provides high confidence in the monument coordinates.
In GE Layers, one option is to display terrain elevation. In the Preferences 3D View tab several terrain options are available, an elevation exaggeration setting and an option for high quality terrain modeling. A digital elevation model (DEM) of satellite data employs vector points and terrain imagery is folded accordingly (Figure 4). This variable from precise is best illustrated with the problem of determination of mountain summits as illustrated in Figure 4, also a placemark in the KML file. Unlike the Waynapicchu summit, photography of mountain summit snow fields often provides far less visual data for summit determination.
Topography, Digital Elevation Models, and Margins of Error
I created this Huascaran summit image to illustrate GIS elevation modeling inaccuracy in comparison to precise GPS data. Viewing a grid pattern overlay from various angles and tilts and outlining topographic contour patterns in GE readily illustrates the inherent pattern in digital elevation modeling of satellite data. The limitations of DEMs are made both readily visible and quantifiable.
The added blue lines illustrate the distance between folds in the topographic model, about 75 meters. The shape of the 6720m contour pattern, the red outline, reflects the digital model fold pattern's highest topographic elevation rather than the actual topography. My "huasc" placemark represents the recent Instituto Nacional de Investigación en Glaciares y Ecosistemas de Montaña (INAIGEM) +/- 3.5mm GPS summit determination. The highest elevation in the DEM does not even include the summit because the modeling is based on a pattern of vectors spaced about 75 meters apart.
 Figure 4. Huascaran summit and DEM comparison. INAIGEM determined summit: UTM: 18L 213778.255, 8990724.614, 6756.697 +/- 3.5mm
The highest resolution Shuttle Radar Topography Mission (SRTM) DEM released to the public has a spatial resolution of about 30 meters. The Advanced Spaceborne Thermal Emission and Reflection Radiometer (ASTER) GDEM-2 is considered a more accurate representation than the SRTM elevation model in rugged mountainous terrain, improving on the original GDEM with global resolution of 90 meters and 30 meters in the United States. |
Geodetic Scale
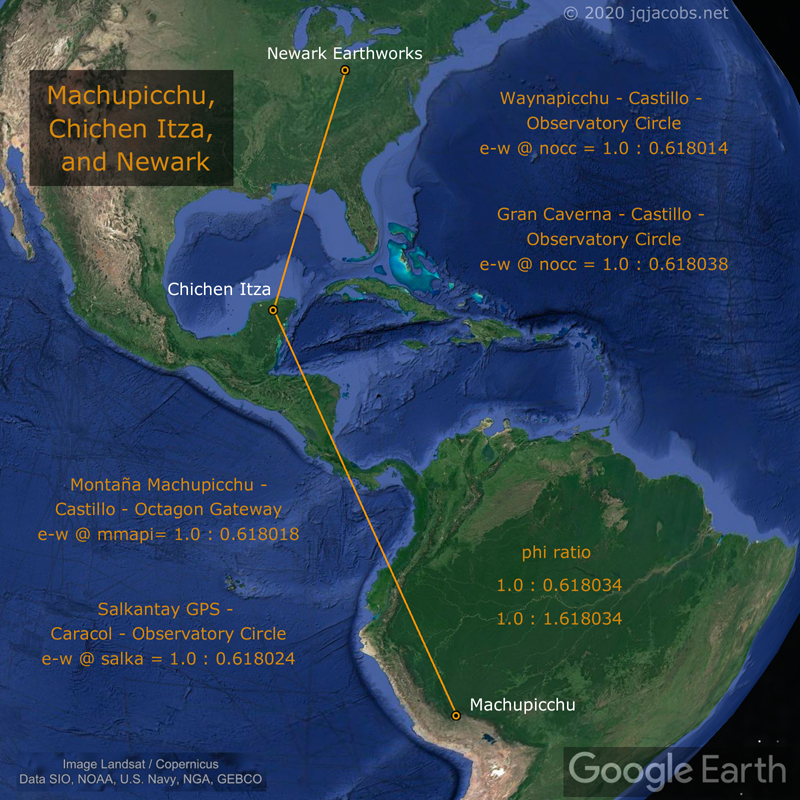
While analysis of the geodetic relationships of monuments requires coordinate precision to provide confidence in results, the context of the relationship considered impacts confidence immensely. The globe is about 40 million meters in circumference and the arc distance from Machupicchu to Newark Earthworks is nearly six million meters. Thus when considering the location of a monument at Newark in relation to Machupicchu, a GPS datum with plus or minus five meter accuracy has a margin of error of five parts in near six million, about one part in one million. Monuments spaced at great distances from each other offer very high confidence in study results when the margin of error is only one part per million. Likewise, to monumentalize an astronomical constant with mathematical precision, the monuments need to be spaced across vast distances. The methodolgy of determining site coordinates herein is certainly sufficient for analysis at this scale and for more proximate considerations too.
For intra-site anaylsis, precise GPS or direct survey is necessary to attain reasonable confidence in the results. Comparing a monument at Machupicchu to the nearby Waynapicchu and Machupicchu peaks, given near precise datums, the margin of error would be nearer five parts in two thousand, or one part in four hundred. The intra-site results in the KML file are in a separate folder due to the lessor geodetic scale and correlated lower confidence in results. Given the correlation between larger scale and much greater confidence in the results, I prefer researching regional and global monument relationships and geodetic properties such as latitude. As previously discussed, I almost entirely eschew determinations on the scale of single monuments, such as alignments of megaliths in a stone circle or openings in earthworks. Of course, global scale relationships and site latitudes provide context and possibly greater confidence in intra-site analyses.
The longitude difference of Cerro Salcantay's DEM coordinate and the Intiwatana is just over fifty meters. The Cerro Salcantay coordinates (sallq) are based on digital elevation modeling, unlike the GPS coordinates for Apu Salkantay (salka). When two sites on a meridian are compared with a third site, the margin of error proportion can be even more significant. Expressing this difference in relation to another longitude difference in an east-west ratio, the ratio's margin of error can result in zero confidence. These ratios can only be considered approximate and while many such preliminary results may be interesting and are recorded, they are not presented. The few DEM coordinates and results in the KML file and herein discussed represent larger scale relationships. Interesting relationships between Machupicchu and surrounding peaks with only DEM coordinate data are all considered preliminary and few are presented herein or in results placemarks.
Tectonic Motion
Another important factor impacts ancient monument coordinate accuracy, the older the construct the greater the monument displacement due to tectonic motion. I included a tectonics folder in the Chavin KML file to model Chavin's motion since the Neolithic, about the time the Giza pyramids were built (east of Chavin 108.31 degrees, cosine = -0.314159). While greater scale of monuument spacing enables greater accuracy in relationship results and higher precision in correlated numerical expressions, with global distances the tectonic motion variable is a factor, and proportionately moreso the more ancient the monuments. Individual site tectonic motion modeling is required to correct coordinates for ancient positions. Some coordinates in the archaeogeodesy.xls applet have recalculated positions for the Neolithic epoch (-4739, when obliquity was 24.0°).
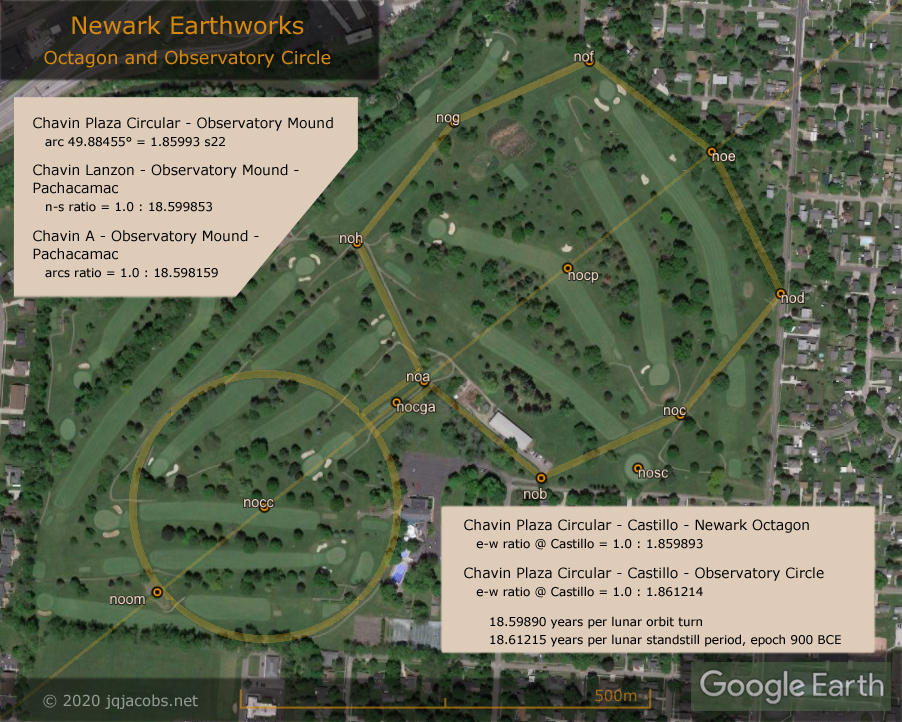
An advantage to study of Inca monuments in a global context is their recent antiquity, thus tectonic motion is less a factor. With the tectonic motion variable, which individual monuments or mountains and which relationships are considered is also a significant factor. At the Newark Earthworks complex, tectonic motion is near exactly east-west so site latitude is consistent over long time periods. Thus, tectonic motion is less a factor in accuracy of Newark's north-south arc distances and ratios. This is just one example of the complex considerations inherent due to tectonic motion. Margins of error are variated by each site's tectonic motion, antiquity, and the particular relationship, a complex combination unique to each consideration. |